A Pilot Study of Pokémon Biodiversity
In which I use Pokémon to coax myself into reviewing my biology notes from a very long time ago 🦇
Hello!
You’re reading issue #23 of Light Gray Matters. Continuing my exploration of diversity, we now dig up stuff from a class I took about 10 years ago as part of my previous life as a biology student.1
The goal today is to mathematically describe biodiversity. We’ll examine four diversity indices that take into account species richness and evenness, illustrating the several ways that biodiversity can be calculated. This constitutes another brick in the foundation of my study of diversity in general.
I know math can be scary. As math is one of my guilty displeasures, I’m somewhat reluctant to dive into it, too.
So to ease the pain, we’ll use Pokémon as an example.
What we’re going to do is calculate the biodiversity of various locations in Pokémon Red Version, one of the first generation games from the late 1990s.
But first, some Pokémon basics:
When you play a Pokémon game, you can find wild Pokémon (which you must either defeat using your own pet Pokémon, or run away from) in the high grasses or inside places such as caves. There are 898 kinds of Pokémon as of writing this; in the first games, there were 151. Every location in the game has a specific set of Pokémon species you can encounter, with their frequencies.
For example, let’s consider Viridian Forest, an area Pokémon Red players must cross early in the game:
If you find a wild Pokémon in the forest’s high grass, it is likely to be a Weedle (50% chance) or a Kakuna (35%). More rarely, that Pokémon will be a Caterpie, Metapod, or Pikachu (5% each).2
That these frequencies are god-given (or, well, game programmer-given) makes things much easier for our purposes. In real life, measuring biodiversity is really hard, because it’s borderline impossible to conduct a census of every individual living being in a patch of land — even a tiny patch of land — in order to calculate the exact frequencies. Biologists rely on statistical methods, so we usually only have estimates. And there’s always a chance we have completely missed some rare species.
In addition, no one agrees on what a species truly is in the real world. But Pokémon species are as fixed and intelligently designed as what most pre-Darwin naturalists believed, so again, much easier for us.
I should also mention that Weedle and Kakuna are in fact not distinct species in any meaningful sense, but rather different larval stages of a same bug species (whose last stage is the terrifying Beedrill). Same deal with Caterpie and Metapod. So there are only three species in this forest:
Weedle family (85% frequency)
Caterpie family (10%)
Pikachu (5%)
Other locations in the game have different species and distributions. Here’s an arbitrary sample of six other places.
Route 6:
The caves of Mt. Moon (near the surface):
Route 13 (Oddish and Gloom are the same species):
The Safari Zone (male Nidoran and Nidorino are the same species. Though they’re a distinct species from the female counterpart Nidorina. Yeah, Pokémon isn’t aways biologically accurate):
Cerulean Cave:
Route 20 (which isn’t a very interesting place to find wild Pokémon):
Now that you’re properly drawn into the post thanks to cute (and less cute) fictional creatures, let’s introduce the math part.
A diversity index is a concept from information theory to measure the diversity in a population. We’ll see the four main ones.
The first index is species richness. Looking at the screenshots above, you would probably guess that Cerulean Cave is more diverse than Route 20, just by counting the species. Indeed. That’s all there is to species richness.
Viridian Forest: 3 species
Route 6: 3
Mt. Moon: 4
Route 13: 4
Safari Zone: 8
Cerulean Cave: 10
Route 20: 1
So far the math is almost insultingly easy. But species richness isn’t the whole story — because it doesn’t take into account the frequencies.
Recall that in Viridian Forest, you have an 85% chance of finding a Weedle or Kakuna, and only a 15% chance of finding anything else. Whereas in Route 6, the distribution is more even: the most common species, Oddish, only has a 40% frequency.
Same story with Mt. Moon, where you’ll be encountering annoying Zubat most of the time (79% frequency) and very rarely a Clefairy (1%). Whereas in Route 13, which has the same number of species, you’re likely to get a feeling of greater diversity with its more even mix of Oddish/Gloom, Pidgey, Venonat, and the occasional Ditto.
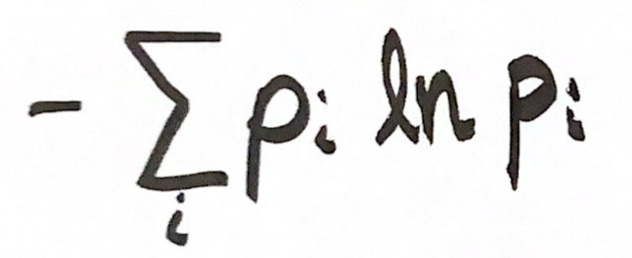
To take into account the “spread” or “evenness” of species in a habitat, let’s introduce Shannon’s diversity index. This is in fact a general measure of entropy, originally developed by Claude Shannon to describe the uncertainty associated with predicting the next letter in a string of text.
Here’s the formula:
where p is the relative abundance (i.e. frequency) of a species i. (And ln is the natural logarithm, in case you forgot everything you once knew about math.) In Viridian Forest, the p’s of all three species are 0.85, 0.10, and 0.05, so we compute the sum:
- [ 0.85 × ln(0.85) + 0.10 × ln(0.10) + 0.05 × ln(0.05) ] = 0.51818621305
This doesn’t mean much on its own. But it’s useful to compare with other habitats:
Viridian Forest: 0.52
Route 6: 1.08
Mt. Moon: 0.67
Route 13: 1.19
Safari Zone: 1.73
Cerulean Cave: 2.08
Route 20: 0.00
Shannon’s index incorporates both richness and evenness. So it’s no surprise that Cerulean Cave, the most species-rich place, gets the highest value. Meanwhile, poor Route 20, plagued with nothing but floating Tentacool jellyfish, has zero diversity.
When comparing locations with equal richness, we see that Shannon’s index assigns higher diversity to Route 6 and Route 13 compared to Viridian Forest and Mt. Moon, respectively. We also see that Route 6, with only three species, is actually more diverse than Mt. Moon and its four species — again, because Mt. Moon is basically just a big nest of Zubat.
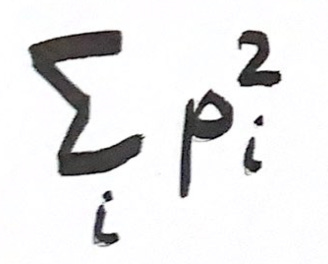
The third diversity index is the Simpson index. The formula is:
where, again, p is the relative abundance of a species i. By multiplying the abundances with themselves, we get the probability that two randomly picked Pokémon belong to the same species. Here, a higher index means less diversity.
Viridian Forest: 0.74
Route 6: 0.34
Mt. Moon: 0.65
Route 13: 0.34
Safari Zone: 0.21
Cerulean Cave: 0.14
Route 20: 1.00
Thus the probability that the next two Pokémon you find are identical is, in Mt. Moon, 65% (very likely two Zubat). In Route 20, it is 100%, since there’s nothing but Tentacool. In the more diverse areas, you only have a 15-20% chance of encountering the same species twice in a row.
The overall trend is similar (though not necessarily identical) to the Shannon index, but the Simpson index is easier to understand.
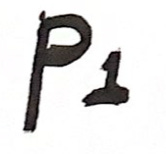
The fourth and last index I’m covering is the Berger–Parker index, a fancy name to describe an extremely simple concept. Behold the formula (if we can call it that):
which is simply the abundance of the most common (#1) species. This is also called the dominance index. A high value suggests a less diverse habitat, since most individuals belong to a single species.
Viridian Forest: 0.85
Route 6: 0.40
Mt. Moon: 0.79
Route 13: 0.45
Safari Zone: 0.35
Cerulean Cave: 0.25
Route 20: 1.00
It’s such a simple index that it doesn’t capture everything — all information about the less common species is ignored. Route 13 looks less diverse than Route 6, but actually has more species. Even if there were twenty different rare Pokémon species in Route 6, that wouldn’t matter if Oddish’s abundance remains constant (although that would be captured by the other indices). In a way, this index is the polar opposite of species richness.
In any case, it does make awfully clear that you’ll bee seeing mostly the same thing when visiting Viridian Forest or Mt. Moon.
There’s more to diversity indices that what I covered here. But that should be enough to hammer the main point, which is: There is no single way to calculate biodiversity. Both the number of species and evenness are important, but how important relative to each other is an open question.
Combining this with last week’s colored dots, we can also see that the various patterns of richness vs. evenness contribute to habitat diversity. It is fun that, in the Pokémon game, some areas are very diverse while some aren’t. Cerulean Cave is more interesting than Route 20, but the entire game world is richer because both exist.
We’re getting a lot of our fundamentals covered, with the past few posts! Next week, I intend to look at the opposite of diversity: uniformity.
Until then I remain
Yours in wanting to be the very best 🎵 like no one ever was 🎵,
Étienne
P.S. Some cool further reading in the field of “pretending to do biology while just writing about Pokémon because it’s fun”:
P.P.S. This is related to diversity, but not to Pokémon: yesterday, I published a Twitter thread about the vast variety of citrus species, most of which are hybrids. Fun to write and, I think, fun to read:

The class was BIOL 310, Biodiversity and Ecosystems, and was taught by prof. Jonathan Davies, whom I thank for teaching a class that I remember more than most.
The screenshots showing frequencies are from serebii.net.


